


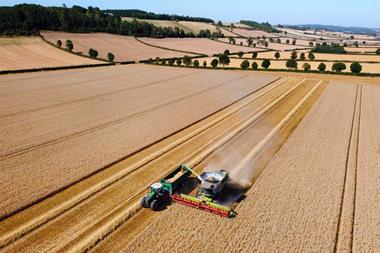
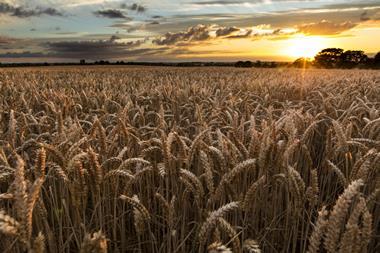
The long spell of dry, sunny weather this year has helped increase protein levels of UK breadmaking wheat above those from 2024 or 2023 harvests.
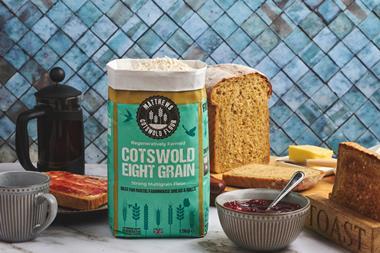
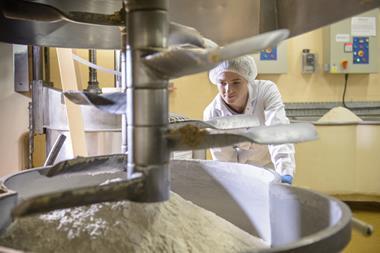
Joe Brennan, head of technical and regulatory affairs at UK Flour Millers, noted how breadmaking wheat quality in 2025 has been broadly good with a strong gluten. “On this basis we expect a greater proportion of the UK wheat crop will meet the typical breadmaking wheat specification for milling,” he said.
While admitting it is difficult to predict trade patterns, Brennan said it could be expected that the volume of imports to decrease compared to the previous two years. Heavier storm rainfall in the autumn and winter of 2023 had disrupted English farmers’ ability to grow key crops such as wheat, leading to a poor harvest in 2024 which left bakers dependent on imports.
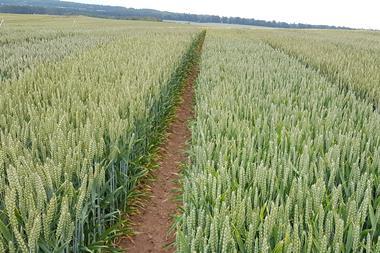
As forecasted earlier this year, wheat area recovered but the share in plantings of breadmaking wheat – classified as Group 1 and Group 2 by the milling trade body – decreased. This is primarily due to a widening yield gap with newer Group 4 varieties (mostly used as feed wheat), with some farmers switching to grow them instead, revealed Brennan.
The roster of Group 1 wheat varieties is relatively old too, meaning they require additional care and attention to disease management to preserve yield and quality. Brennan highlighted the emergence of two new Group 1 varieties – ‘SY Cheer’ and ‘KWS Vibe’ – over the past two years. “These show good breadmaking quality and good agronomic packages, particularly with regards to disease resistance, and there looks to be good interest from growers in these varieties,” he added.
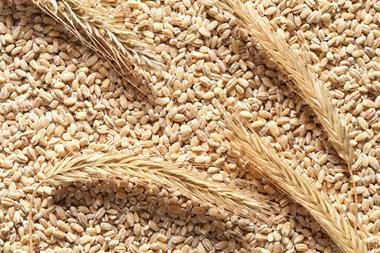
Despite being in decline in recent years, Group 3 wheat varieties saw a sharp rise in popularity for the 2025 harvest. Among these is the new ‘Bamford’ variety, which shows good biscuit wheat quality and excellent agronomic quality with good disease resistance and high yield.
The comments on UK breadmaking wheat levels came at a time when Defra has released estimates of cereal (wheat, barley and oats) and oilseed rape production in England from the 2025 harvest. Figures for Scotland are expected from the Scottish government this week, while those for Northern Ireland and Wales are to follow in December.
The England figures (see table below) were compiled in a report from the Agriculture and Horticulture Development Board (AHDB), which showed a small rise in wheat production but a provisional decline in total cereals due to a big drop in barley, especially spring barley. The estimate makes it the lowest barley harvest since 2012.
Provisional 2025 production estimates for major crops in England
| Arable crop (thousand tonnes) | Harvest 2025 | Harvest 2024 | Year-on-year change | Ten-year average |
|---|---|---|---|---|
|
Wheat |
10,610 |
10,113 |
5% |
12,853 |
|
Barley |
4,155 |
4,847 |
-14% |
5,112 |
|
Winter barley |
1,972 |
2,017 |
-2% |
2,435 |
|
Spring barley |
2,183 |
2,830 |
-23% |
2,677 |
|
Oats |
755 |
773 |
-2% |
720 |
|
Oilseed |
722 |
684 |
5% |
1,414 |
Gabriel Odiase, cereals & oilseed analyst at AHDB, pointed out that the 5% increase in wheat still left it around 17% below the 10-year average of 12.9Mt, which ranged from a high of 15.2Mt in 2015 to a low of 8.7Mt in 2020. “The increase this year is largely due to a 9% rise in cropped area, following a challenging 2024 season when wet weather limited autumn sowing,” he noted.
The AHDB report also looked at the split data from the various wheat growing regions in England (see figures in table below). The strongest wheat output remains in the East and East Midlands while most regions provisionally saw improvements on last year, due to larger areas, with East and South West being the exceptions.
Provisional 2025 wheat production (Kt) by English region
| Region | Harvest 2025 | Harvest 2024 | Year-on-year change | Ten-year average |
|---|---|---|---|---|
|
North East |
480 |
357 |
+35% |
481 |
|
North West and Merseyside |
174 |
155 |
+12% |
176 |
|
Yorkshire & The Humber |
1,625 |
1,401 |
+16% |
1,662 |
|
East Midlands |
2,047 |
1,883 |
+9% |
2,246 |
|
West Midlands |
933 |
901 |
+4% |
1,063 |
|
Eastern |
3,043 |
3,064 |
-1% |
3,425 |
|
South East and London |
1,401 |
1,401 |
Unchanged |
1,572 |
|
South West |
908 |
952 |
-5% |
1,110 |
|
England |
10,610 |
10,113 |
+5% |
12,853 |


No comments yet